We Analyzed 102,000 Insider Purchases: Which Insiders Are Worth Following (and Which Beat Their Peers but Still Lose Money)
Key findings
- Sector: insurers and financials did best (+3.9% vs matched stocks), telecom and media worst (-4.4%, suggestive). Biotech beats its peers but still loses money (raw median -5.1%).
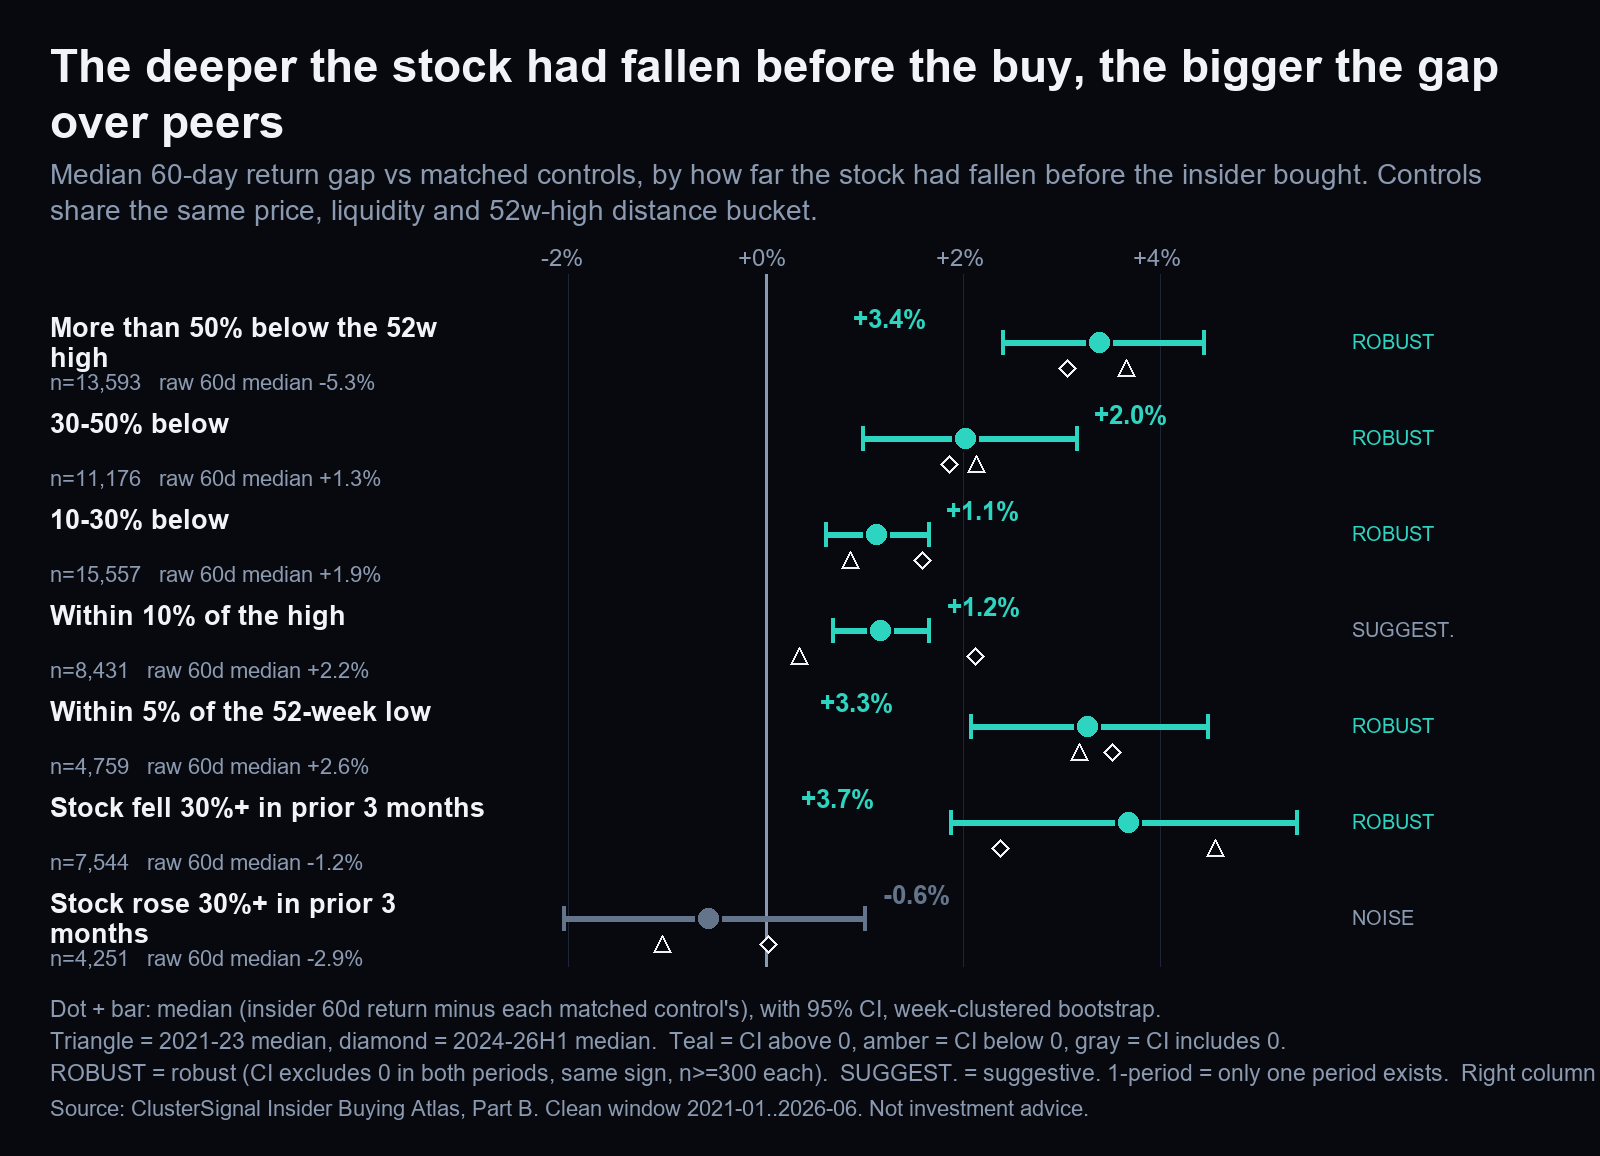
- Near the 52-week low: buys within 5% of the low were the only bucket above the baseline in both test periods (+3.3% vs matched stocks, raw +2.6%).
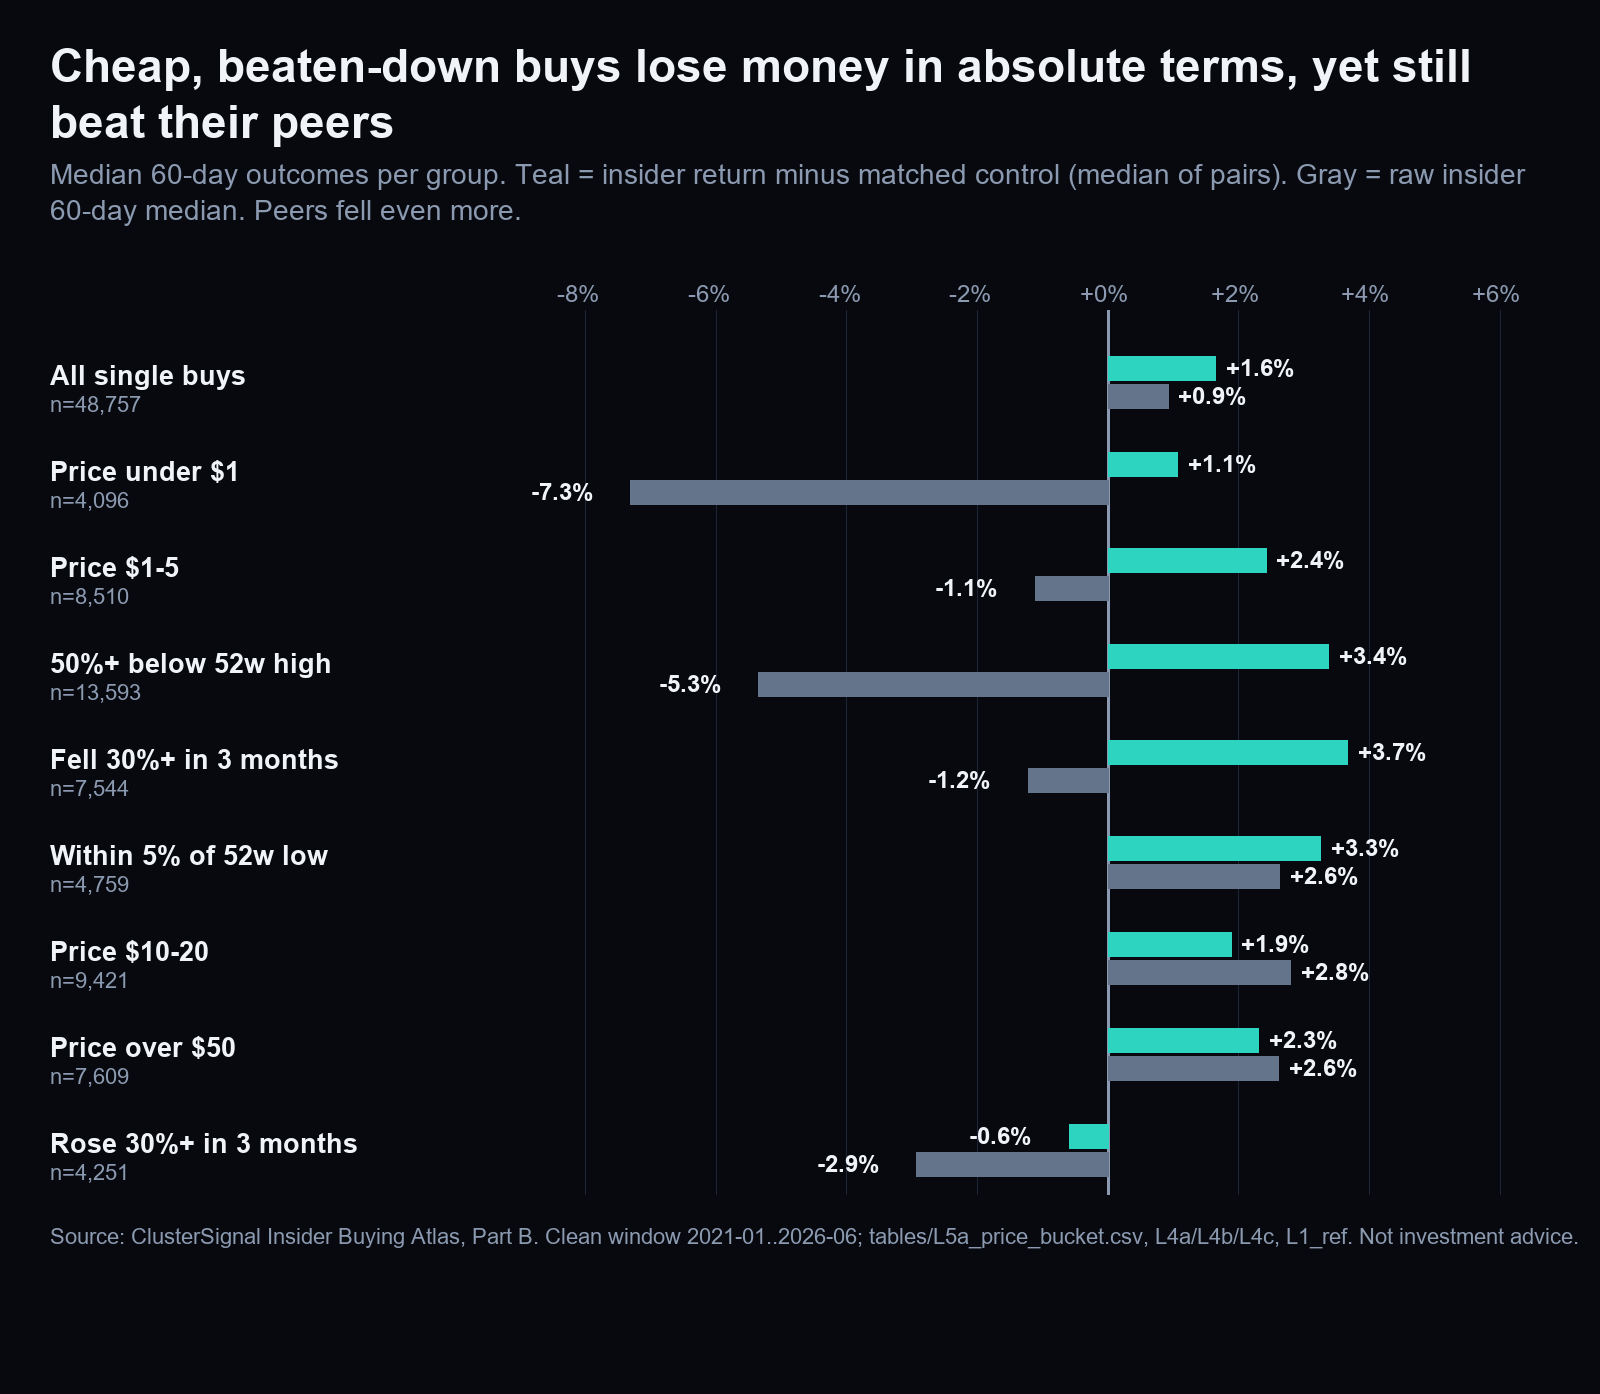
- Sub-$5 stocks and deep drawdowns lose money in absolute terms (raw -1.3% and -5.3%), even though they beat their matched controls.
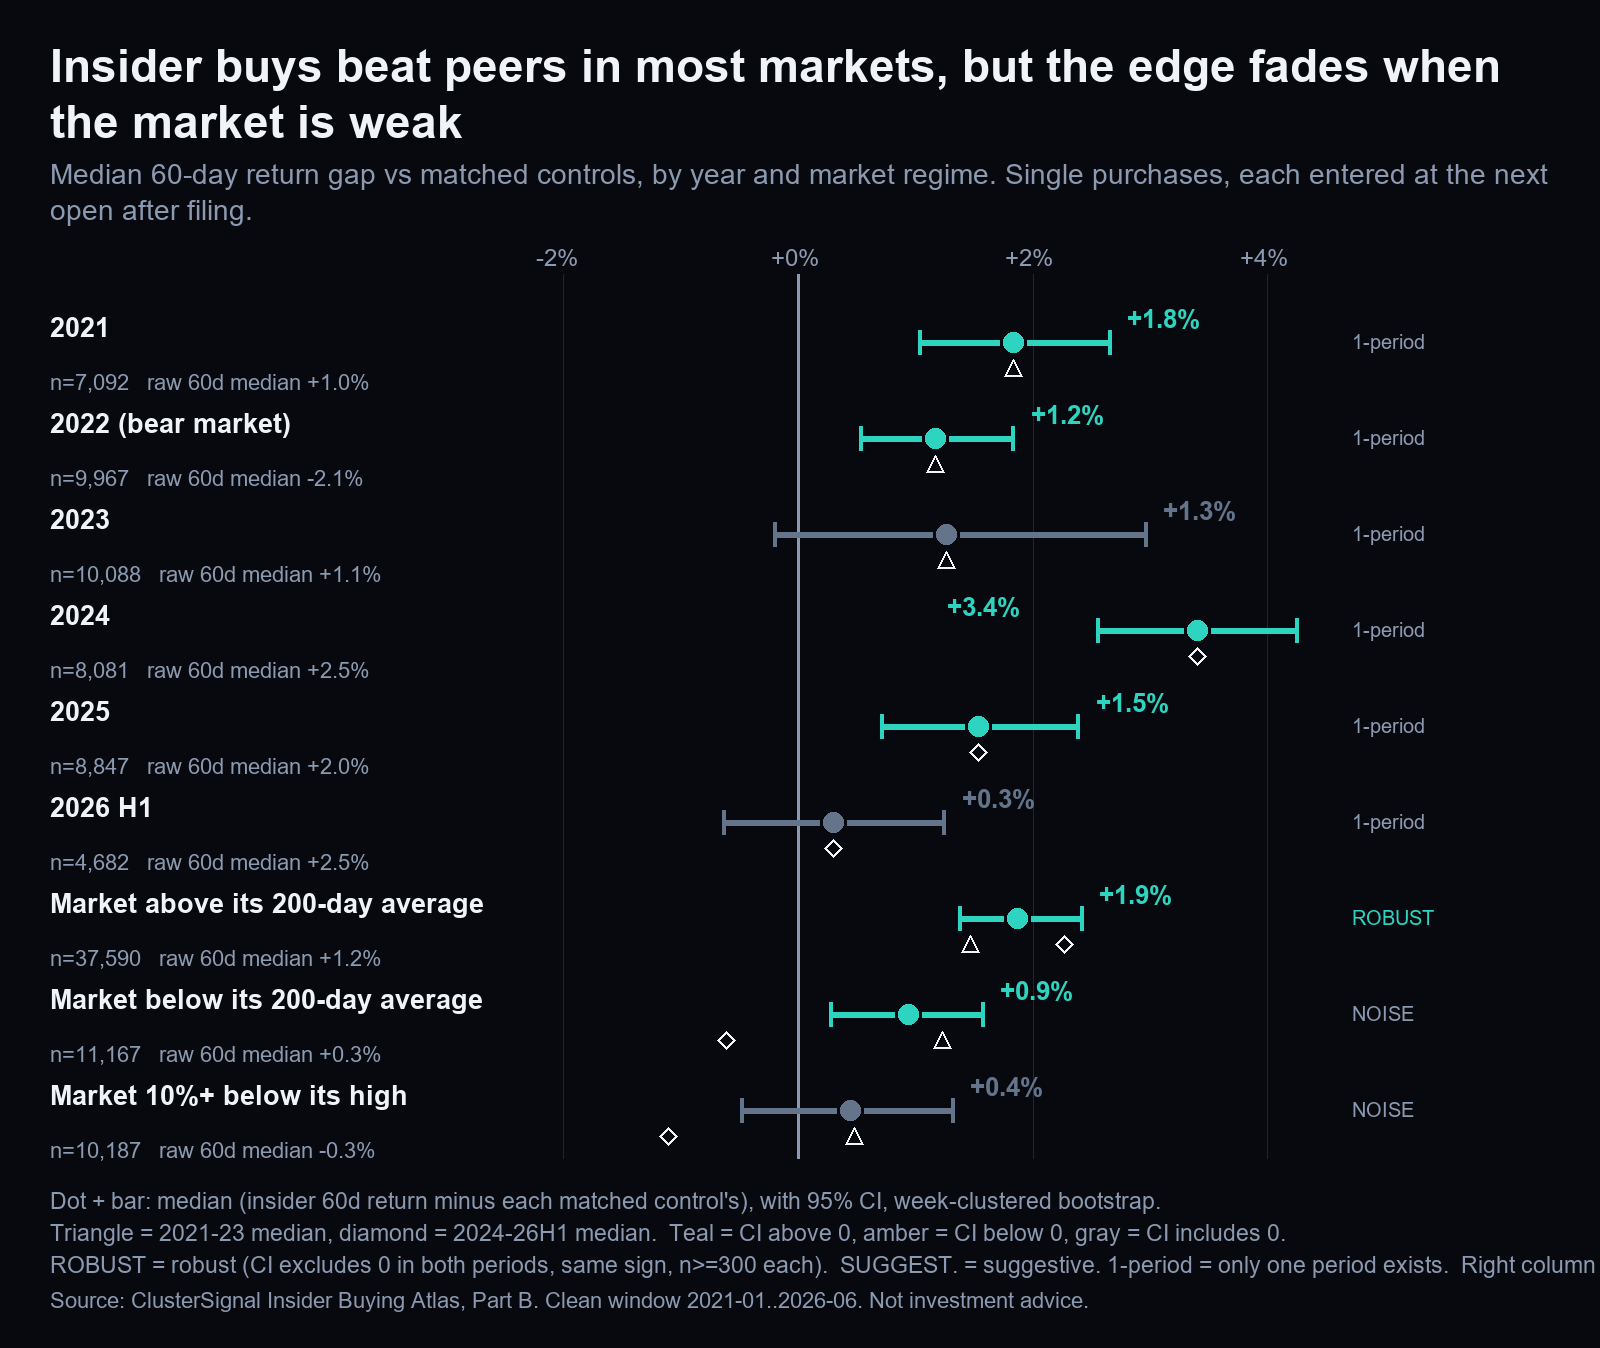
- No edge after a 30%+ run-up, or when the S&P 500 (SPY) is below its 200-day average.
- Raw clusters versus single buys is a null result. Clusters are a starting point; quality filters are where the edge is.
Our previous study found that the typical lone insider buy does not beat small caps. That raises a better question: are there kinds of insider purchases that are worth paying attention to, and kinds that look good but are not? We built the Insider Buying Atlas to find out, slicing the same history by sector, price, drawdown, distance from the 52-week low and market regime.
How we measured
- Data: OpenInsider open-market purchases filed January 2021 to June 2026.
- Entry and horizon: the next market open after the filing, held 60 trading days.
- "Edge": the median difference between the insider purchase and matched stocks with no insider buying, with a 95% confidence interval from a week-block bootstrap. It tells you whether insiders beat similar stocks, not whether you made money.
- Raw return: the plain median 60-day return. We always show it next to the edge, because many groups beat their peers while losing money.
- Labels: a finding is ROBUST only if its interval excludes zero in both 2021-2023 and 2024 to mid-2026, with at least 300 trades in each period. Anything else is SUGGESTIVE or noise, and we say so.
The yardstick: +1.6% for all single buys
All single insider buys beat matched controls by +1.6% (ROBUST). But their raw median was only +0.9%, and they trailed the Russell 2000 (IWM) by 1.4%. Every bucket below should be judged against that +1.6% edge and against its own raw return.
Finding 1: sector matters, and biotech is a trap
| Sector | Edge vs controls | Raw median 60d | Evidence |
|---|---|---|---|
| Insurance / financial | +3.9% [+2.5, +5.5] | n/a in summary | ROBUST |
| Banks | +2.2% | +3.8% (win rate 64%) | Above baseline |
| Industrials | +1.7% | n/a in summary | Around baseline |
| Biotech / medtech | +1.6% to +1.9% | -5.1% / -2.7% | Beats peers, loses money |
| Telecom / media | -4.4% | -5.1% | SUGGESTIVE |
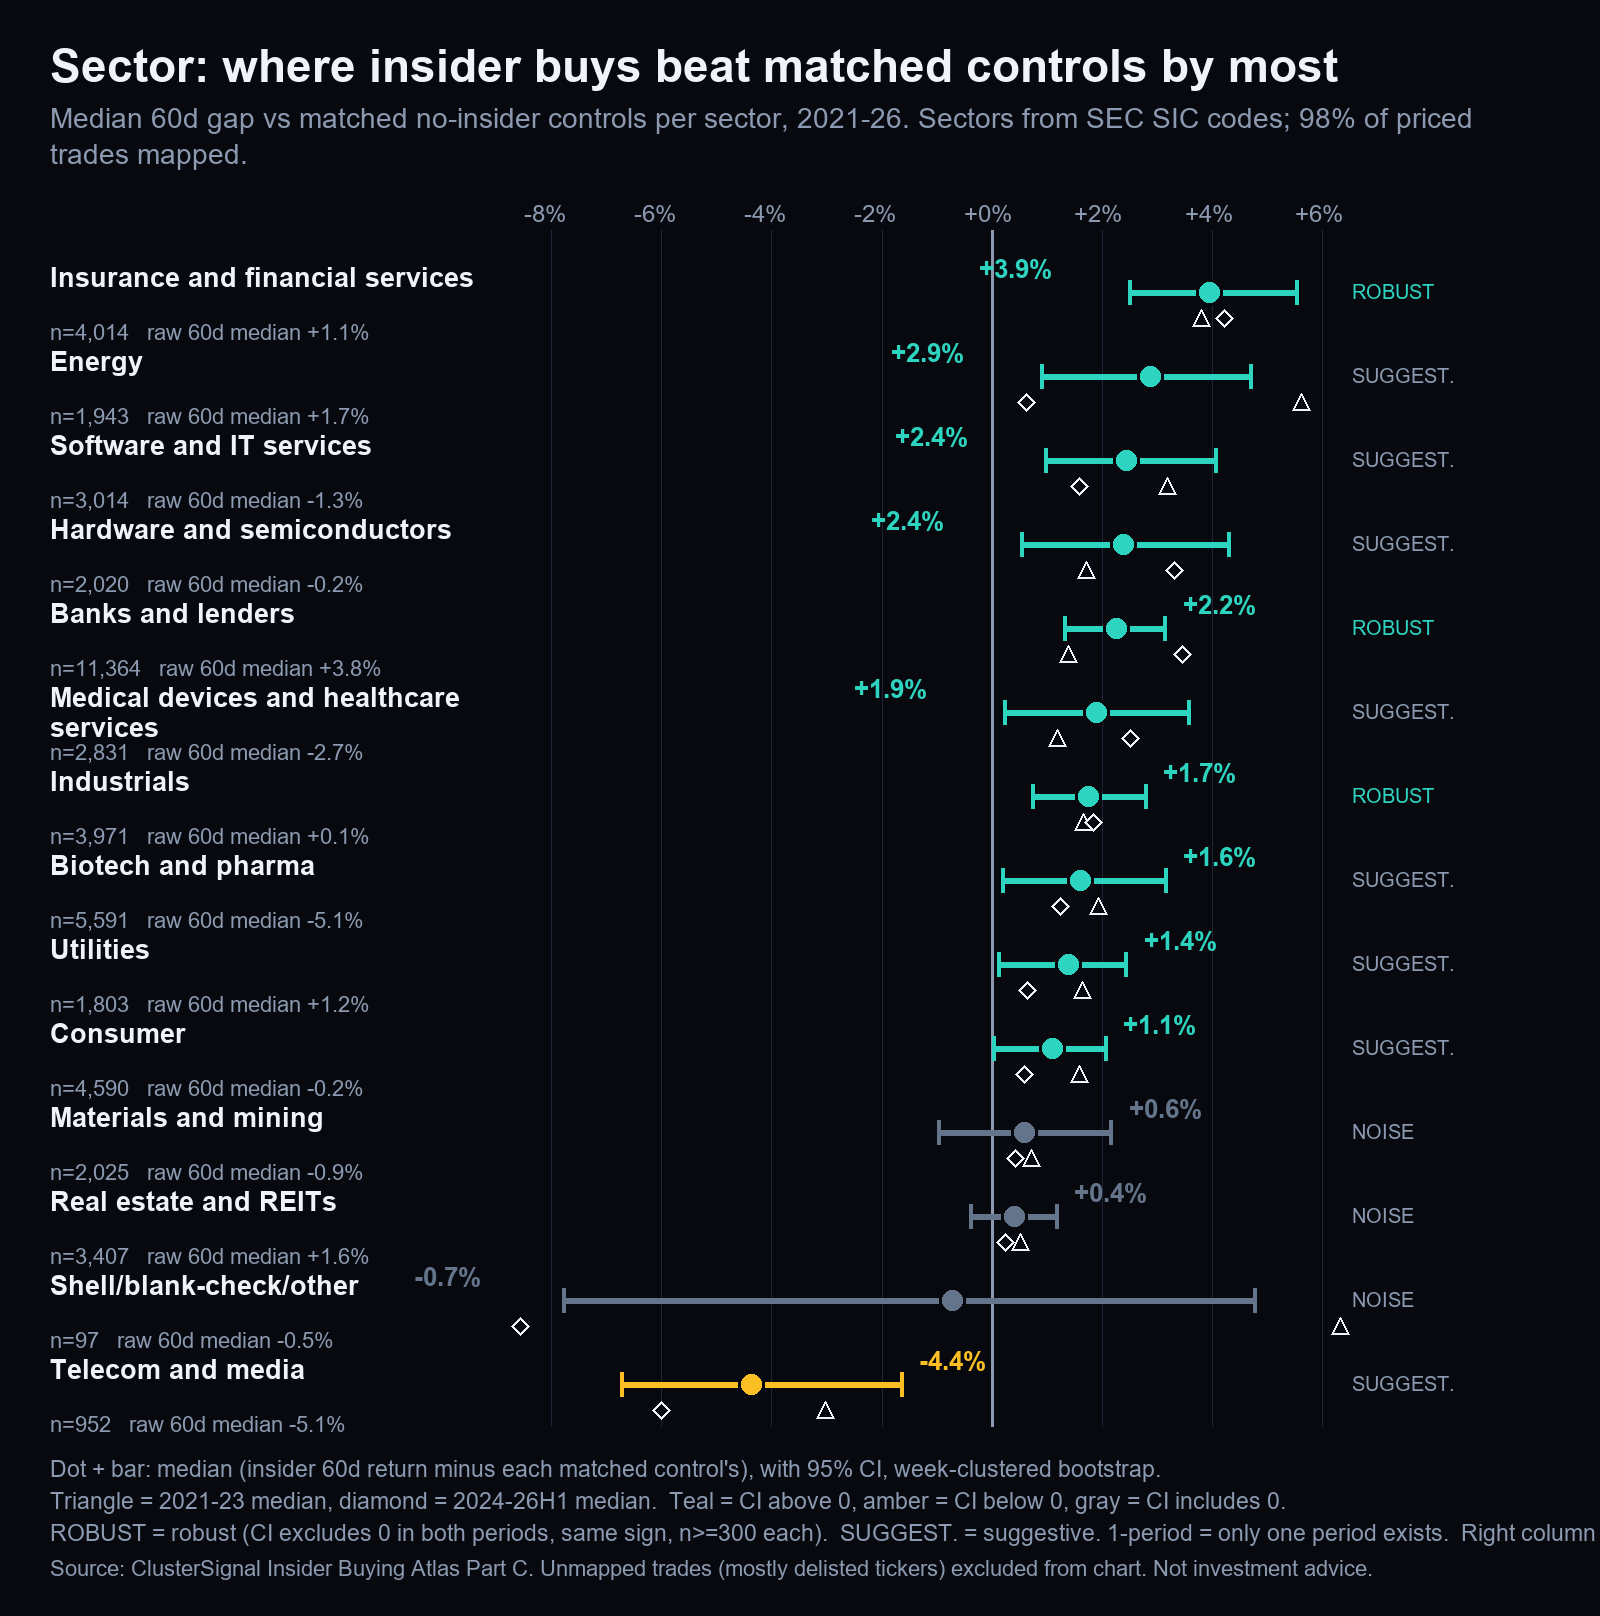
Biotech and medtech are the clearest example of why the raw return matters. Insiders did beat comparable stocks there, but the stocks themselves fell, with a median 60-day return of -5.1% for biotech and -2.7% for medtech. An "edge over peers" in a falling group is still a loss.
One caution on all sector results: delisted companies are under-represented in the data, so part of the sector pattern may come from survivorship rather than from insider skill.
Finding 2: near the 52-week low
Purchases within 5% of the 52-week low had a raw median 60-day return of +2.6% and an edge of +3.3% over matched controls. It was the only bucket we tested that sat above the baseline in both periods. We tested many buckets, so treat it as a pattern worth watching, not a rule.
Finding 3: beats its peers yet loses money
Two groups beat their matched controls but still had negative raw medians:
- Stocks under $5: raw median -1.3%.
- Stocks more than 50% below their high: raw median -5.3%.
Finding 4: market regime and run-ups
We found no edge after a 30%+ run-up in the stock (classified as noise), and no edge when SPY was below its 200-day average. Insider buying did not make a weak market or an extended stock any safer.
Finding 5: clusters versus single buys is a null result
ClusterSignal is built around clusters, so we tested the idea honestly. Raw detector clusters (one per episode) beat single buys by +1.0%, with a 95% interval of -0.6% to +2.5%. That is noise, a null result. It is not proof that clusters are worse, only that we cannot show they are better. The raw cluster median return was +0.1%.
- No cluster sub-type was ROBUST.
- Officer-led clusters showed +2.8% (n=323), which is SUGGESTIVE only.
- Clusters with 4 or more insiders showed +4.3% (n=96), but the size is only known in hindsight, so it cannot be traded on.
- Clusters flagged as a likely disguised offering (n=16) had a raw median of -7.1%.
Our reading: clusters are a starting point; quality filters are where the edge is. The one combination that held up as ROBUST was buys 30-50% below the high that had also fallen 30% or more in three months (n=1,216, raw median +9.9%, win rate 68%). But we picked it from 160 combinations we screened, so it is the most likely to be a lucky find.
How ClusterSignal's alerts compare (same months)
The obvious question is where our own alerts sit. To compare fairly, we took only the months our alerts cover (entries March to June 2026, 60-day returns) and ran every group through the same lens.
| Group | n | Raw 60d median | vs matched controls |
|---|---|---|---|
| All single insider buys | 3,673 | +3.6% | +0.5% [-0.6, +1.5] |
| Raw clusters (per episode) | 95 | +2.8% | -2.5% [-7.4, +2.5] |
| Combo: 30-50% below high + 3-month drop of 30%+ | 107 | +10.5% | +3.0% [-1.7, +7.9] |
| Combo: price over $50 + average daily volume $10-50M | 117 | +7.2% | -0.1% |
| ClusterSignal Results-page alerts | 27 | +14.5% | +9.5% [+1.7, +30.4] |
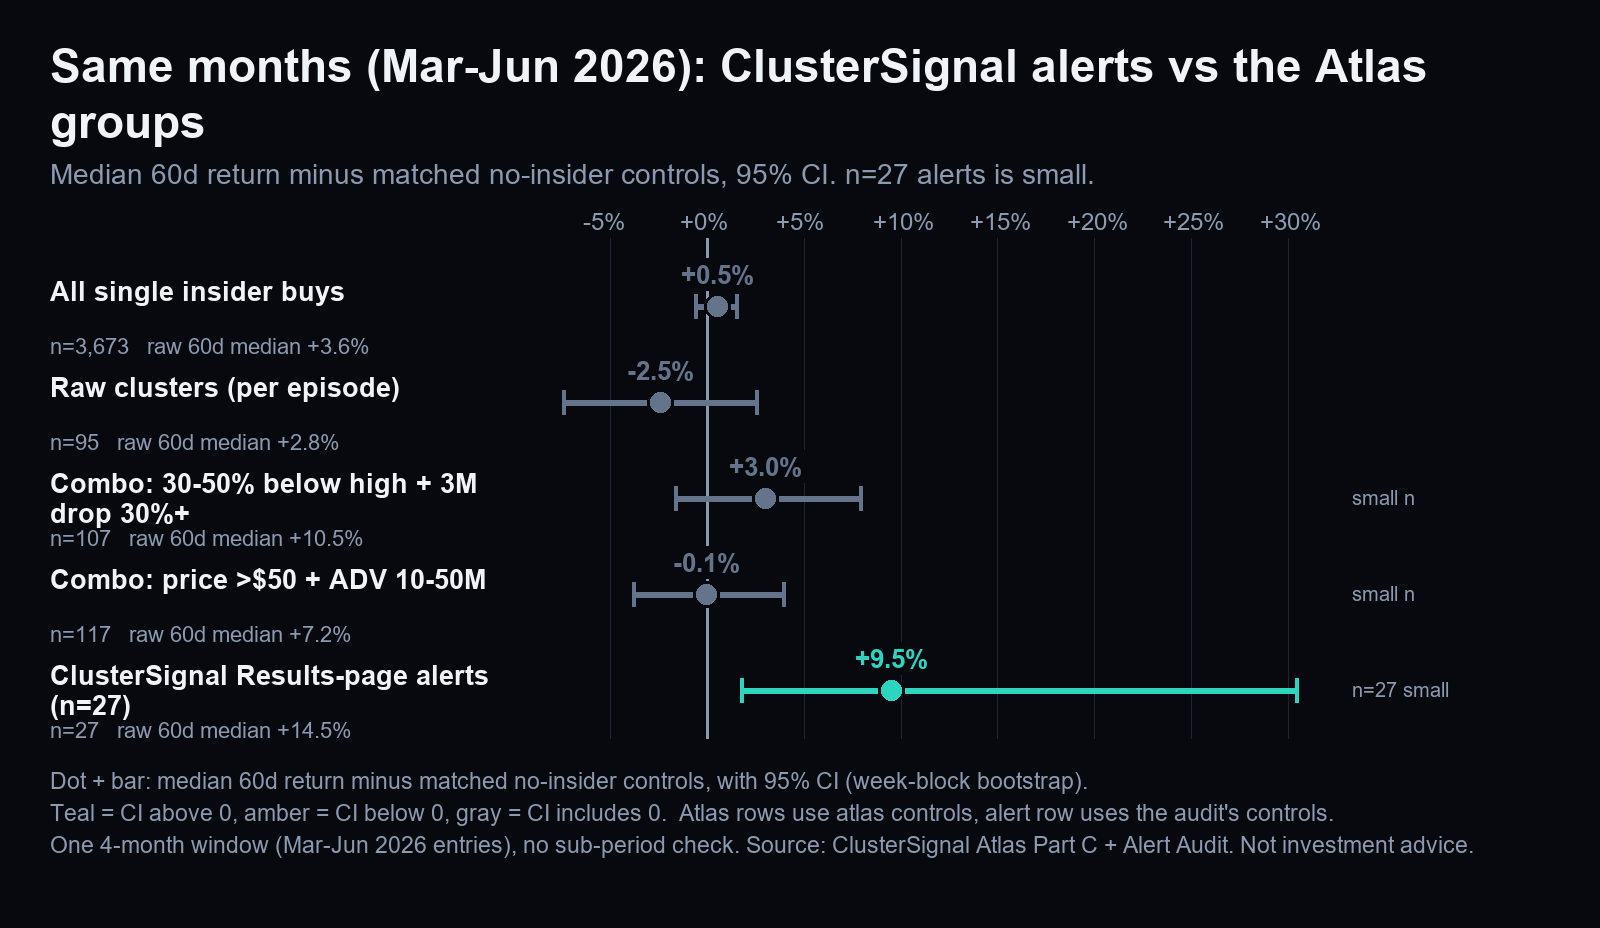
The alert row is the best in the table, but n=27 in one four-month window is promising, not proven. The interval is very wide (+1.7% to +30.4%), and the alerts' headline figures match what we published in Do insider buying alerts beat the market? (+11.1% vs SPY, +9.8% vs IWM, and +5.2% vs plain insider buys with an interval of -0.2% to +23.0%, which includes zero). Counting all 70 alerts, including retired ones, the picture is weaker: with 43 results at 60 days, the median was +7.2% raw and -1.5% against matched controls (interval -9.7% to +16.0%).
Why might the alerts differ from the raw groups? Their mix is different: 76% are priced above $10 (59% in the Atlas), none trade under $0.5M a day (24% in the Atlas), and 69% are 30% or more below their 52-week high (52% in the Atlas). Those are the kinds of patterns this study found to matter. That fits a story of selection by price, liquidity and drawdown, but we did not test it causally. For the single-insider side of the story, see Should you copy a single insider's trades?
Limits of this study
- Multiple testing. We ran 149 interval tests and screened another 160 combinations by point estimate. About 7 false positives are expected by chance alone, which is why we only call a result ROBUST when it repeats in both periods.
- Survivorship bias. 27% of candidate purchases have no price data, mostly delisted or renamed companies.
- Sector results are partly survivorship-driven. Delisted names are under-represented in the sector layer.
- Timing proxies. Earnings timing uses a quarter-end proxy, not real earnings dates.
- Missing data. We have no insider sales data, so we skipped the "sold, then bought" layer. Only 928 of 2,245 cluster episodes had a priced trigger trade with controls.
- Small alert sample. The ClusterSignal comparison rests on 27 alerts in a single window.
Frequently asked questions
Which sectors do insider purchases work best in?
Insurance and financial companies did best: insider buys beat matched stocks by a median +3.9% over 60 trading days (95% interval +2.5% to +5.5%), a result that held in both test periods. Banks were +2.2% and industrials +1.7%. Telecom and media did worst at -4.4% (suggestive only). Sector results are partly driven by survivorship bias.
Do biotech insider purchases work?
Biotech and medtech insider buys beat their matched controls by about +1.6% to +1.9%, but the stocks still lost money: raw median 60-day returns were -5.1% for biotech and -2.7% for medtech. Beating peers is not the same as making money.
Are insider buys near the 52-week low better?
Purchases within 5% of the 52-week low had a raw median 60-day return of +2.6% and an edge of +3.3% over matched controls, the only bucket above the +1.6% baseline in both test periods. Because we tested many buckets, treat it as a pattern to watch, not a rule.
Do insider buys of cheap or heavily fallen stocks make money?
Not on average. Stocks under $5 had a raw median 60-day return of -1.3%, and stocks more than 50% below their high had -5.3%, even though both groups beat their matched controls.
Are insider clusters better than single insider buys?
We could not show it. Raw detector clusters beat single buys by +1.0% with a 95% interval of -0.6% to +2.5%, a null result. Clusters are a starting point; quality filters such as price, liquidity and drawdown are where the edge appears to be.
Is this investment advice?
No. ClusterSignal is an information service. This analysis describes historical data and does not tell anyone to buy or sell a security. Past performance does not guarantee future results.
Related reading
Should you copy a single insider's trades? tests the single-buy idea on 102,000 purchases, and Do insider buying alerts beat the market? tests our scored alerts against four benchmarks.
⚠ ClusterSignal is a financial information service. This analysis and the alerts it describes are for informational purposes only and do not constitute investment advice. Past performance does not guarantee future results. Consult a licensed financial advisor before making investment decisions.
See how scored alerts have done
Every resolved alert, including the losers, is public.
View the Results page →